In general, this concept can have 2 meanings: minimum basket and average basket. In the first case, we mean the minimum set of goods and services necessary for a citizen to live; in the second case, the “average” set of an “average” citizen for a year. In the case of Russia, we are talking specifically about the minimum basket, which shows what a person needs to exist. On the one hand, this parameter is very important, on the other hand, it is very complex: the price of the consumer basket forms the value of the subsistence minimum, but prices for items in the basket vary for different subjects.
Therefore, the link to the basket is gradually being abandoned: if in 2020 the size of the consumer basket still influenced the cost of living, then in 2021 the minimum will be calculated from the median salary in the country, and the basket will become useless.
But we will still tell you about the minimum set of goods and services - it often happens that initiatives in Russia are not introduced as quickly as originally planned, and data about the basket may still be useful.
Consumer basket in Russia
Statistics by year
Many people confuse the concepts of “consumer basket” and “living wage”. The first is the minimum set of things necessary for survival, as we said above, the second is the minimum amount that a person needs per month to buy these things. The consumer basket is stable and does not depend on the subject, but the cost of living is not so stable and depends. Therefore, in this section we will provide the minimum amount for living, and in the next section we will describe the composition of the consumer basket.
So, the table of the cost of living by year:
| Total cost of living, rubles | Pensioners, rubles | Children, rubles | |
| 2000 | 1 210 | 909 | 1 208 |
| 2010 | 5 688 | 4 521 | 5 489 |
| 2017 | 10 088 | 8 315 | 9 925 |
| 2018 | 10 287 | 8 483 | 10 150 |
| 2019 | 10 890 | 9 002 | 10 703 |
| 2021 | 12 702 | 10 022 | 11 303 |
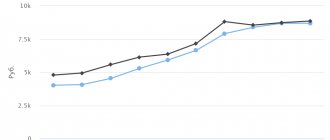
Infographics (red – general, blue – pensioners, green – children):
According to the government, pensioners need significantly less money to live than children and the working population.
Statistics by region
Above were data on the general cost of living, but there are also values for the cost of living by region. List of federal districts and the total cost of living in them:
| Average cost of living, rubles | |
| Russian Federation | 11606 |
| Central Federal District | 13811 |
| Moscow | 18029 |
| Northwestern Federal District | 14467 |
| Saint Petersburg | 11685 |
| Southern Federal District | 10636 |
| Sevastopol | 11396 |
| North Caucasus Federal District | 10124 |
| Volga Federal District | 10211 |
| Ural Federal District | 10842 |
| Siberian Federal District | 11344 |
| Far Eastern Federal District | 18166 |
The highest living wage is in the Chukotka Autonomous Okrug (23,999 rubles), the smallest is in the Voronezh region (9,053 rubles).
As we have already noted, the cost of the consumer basket directly determines the cost of living in different federal districts. The composition of the consumer basket is taken, prices for goods and services are taken from the basket by region - and the subsistence level is obtained.
New federal cost of living in the Russian Federation in 2021
Government Decree No. 2406 dated December 31, 2020 established the living wage for 2021 in Russia as a whole.
Current values for 2021 by population category:
- per capita 11,653 rubles
- for the working population – 12,702 rubles
- for pensioners – 10,022 rubles
- for children – 11,303 rubles
According to Federal Law No. 473-FZ of December 29, 2021, the cost of living per capita in the Russian Federation as a whole for the next year is established by the Government of the Russian Federation, taking into account the opinion of the Russian Tripartite Commission for the Regulation of Social and Labor Relations and is calculated based on the median per capita income for the previous year.
The ratio of the cost of living per capita in the Russian Federation as a whole and the median per capita income for the previous year is set at 44.2 percent from 2021.
For 2021, the cost of living per capita and for the main socio-demographic groups of the population in the subject of the Russian Federation is established by the subject of the Russian Federation in an amount not lower than the cost of living per capita and for the main socio-demographic groups of the population in the subject of the Russian Federation for the second quarter 2021.
Composition of the consumer basket in Russia
The consumer basket consists of 3 main sections: food, non-food products, services. Consumer basket in Russia by food, for the year:
| Product | Working adults | Pensioners | Children |
| Bread, pasta, other sources of carbohydrates, kilo | 126.5 | 98.2 | 76.6 |
| Potatoes, kilo | 100.4 | 80 | 88.1 |
| Vegetables, kilo | 114.6 | 98 | 112.5 |
| Fruits, kilo | 60 | 45 | 118.1 |
| Sugar and sweets, kilo | 23.8 | 21.2 | 21.8 |
| Meat products, kilo | 58.6 | 54 | 44 |
| Fish products, kilo | 18.5 | 16 | 18.6 |
| "Milk", kilo | 290 | 257.8 | 360.7 |
| Eggs, pcs. | 210 | 200 | 201 |
| Oils, kilo | 11 | 10 | 5 |
| Tea/coffee/seasonings, kilo | 4.9 | 4.2 | 3.6 |
Distribution for working population:
The basket focuses on milk and eggs, fish and meat - frankly not enough.
Basket of non-food items:
| Position | Working adults | Pensioners | Children |
| Warm outerwear | 3 at 7.6 years | 3 at 8.7 years | 3 for 2.6 years |
| Regular outerwear | 8 for 4.2 years | 8 for 5 years | 11 for 2 years |
| Lingerie | 9 for 2.4 years | 10 for 2.9 years | 11 for 1.8 years |
| Stockings and socks | 7 for 1.4 years | 4 for 1.9 years | 6 for 1.3 years |
| Hats | 5 for 5 years | 4 to 5.6 years | 4 for 2.8 years |
| Shoes | 6 for 3.2 years | 6 for 3.5 years | 7 for 1.8 years |
| School supplies, pens, notebooks and so on | 3 per year | 3 per year | 27 per year |
| Bed linen | 2 per year | 2 per year | 2 per year |
| Household goods | 2 per year | 2 per year | 2 per year |
| Medicines | 10% of non-food expenses. | 15% of non-food expenses. | 12% of non-food expenses. |
Services statistics:
| Type of service | Working adults | Pensioners | Children |
| Living space, m^2 | 18 | 18 | 18 |
| Heating, gigacalories per year | 6.7 | 6,7 | 6,7 |
| Water and sewerage, liters per 24 hours | 285 | 285 | 285 |
| Gas, cubic meters per month | 10 | 10 | 10 |
| Electricity, kilowatt-hour per month | 50 | 50 | 50 |
| Public transport, monthly usage | 619 | 150 | 396 |
| Culture, % of expenditure per category per month | 5 | 5 | 5 |
| The rest, % of expenses. per category per month | 15 | 15 | 15 |
Differences from subsistence level
The consumer basket in the Russian Federation, although it is an indicator of the well-being of the population close in value to the subsistence minimum, is far from identical. The subsistence minimum is expressed in monetary terms and determines a certain amount required by a person to satisfy his life needs. This, in addition to a set of products, includes various non-food products, as well as necessary services.
Thus, the minimum consumer basket is included in the broader concept of “living wage”. Along with purely physiological needs for food, this also includes the cost of clothing, utilities, public transport, socio-cultural benefits, etc. The cost of living is calculated as the total of all expenses on products, services and essential goods. Accordingly, the food basket, even being an important component for determining the living standard of the population, by itself, in isolation from other components, cannot act as a self-sufficient socio-economic indicator.
Calculating the cost of the consumer basket, in combination with other factors, allows us to establish:
- The minimum amount of income required for a citizen to live in the Russian Federation.
- Changing social and economic trends for better or worse.
- Determine the minimum acceptable level of subsistence level, establish the necessary amounts of social benefits.
- Compare the real cost of living in different regions of the country.
- Obtain comparative data with the socio-economic situation in other countries.
Comparison with basket of other countries
As we noted above, most often the concept of “consumption basket” is used as the average level of consumption of the average resident of the country, so it is impossible to compile a rating, and comparisons, by and large, do not make sense. But we note that the consumer basket looks rather poor compared to other countries: in the USA it includes 300 items, in England – 699. In Canada, all vegetables are listed in detail, prices do not depend on the region, laptops/phones, toys are included in the consumer basket for children and donations to charity.
New methodology for calculating the minimum wage
12,392 rubles
— The previously planned federal minimum wage for 2021, calculated by calculation in accordance with the old methodology approved by order of the Ministry of Labor of the Russian Federation (Orders of the Ministry of Labor of Russia dated 08/09/2019 N 561 n, dated 08/28/2020 N 542 n)
12,792 rubles
-New federal minimum wage for 2021, established in accordance with the new calculation methodology proposed by the Government of the Russian Federation
The new calculation method allows you to bring the PM value as close as possible to reality.
The employer must increase the salary to the new minimum wage, otherwise he cannot avoid fines. Starting from 2021, the minimum wage is calculated using a completely different methodology. Now it depends on the concept of “median salary”, previously unknown to many.
History and dynamics of indicators
We have already given the history/dynamics of the total cost of living in the country above. Note that from 2021 the cost of living will increase significantly, because the basis will be the national median salary, and not the food basket. But some experts express concerns that such changes will actually worsen the situation in the country: the average median salary is growing much slower than inflation, and in 5-7 years it will turn out that, in terms of the food basket, the cost of living will begin to decrease, with visible growth absolute indicators.
Living wage and minimum wage
The minimum wage is the minimum wage. The indicator is directly related to the cost of living. So, part 5 of Art. 75 of the Constitution of the Russian Federation, Part 1, Art. 133 of the Labor Code of the Russian Federation and Federal Law No. 82-FZ dated June 19, 2000, it is established that from January 1, 2021, the minimum wage in Russia cannot be lower than the subsistence level for the working population.
What does equality of indicators give? This is a personal guarantee for the working population that their wages will not be lower than the cost of the minimum needs for a normal life. That is, income, in the form of the minimum wage, cannot be lower than the established need for vital goods, works and services.
This equality has been achieved by the Government of the Russian Federation for several years, and only by the beginning of 2021 the values became equal. At that time, the values reached the amount of 11,280 rubles per month.
In 2021, the minimum wage exceeded the subsistence level for the first time, amounting to 12,792 rubles. In some regions the minimum wage is higher than this figure.
See the minimum wage in 2021 by region of the Russian Federation.
Composition and structure for citizens of different ages
The composition of the consumer basket for 2021 is still regulated by the provisions established by Law No. 227. Previously, it was planned to review the food package every five years. But over the past seven years, no changes have occurred regarding the structure and composition of the consumer basket. In December 2021, Federal Law No. 421 was adopted, according to which the next revision of the list of products and the number of consumption standards should occur no earlier than December 31, 2020. This is due, first of all, to the internal economic problems that began in 2014. Consequently, in 2021 the composition of the consumer basket will remain unchanged.
For adults, children and pensioners, the minimum annual consumption of essential products is:
Product name /Consumption by adults /Pensioners Children
- Bakery, pasta and cereals 126 kg /98 kg /77 kg
- Potatoes 100 kg /80 kg /88 kg
- Vegetables 114 kg /98 kg /112 kg
- Fruits 60 kg /45 kg /118 kg
- Sugar and confectionery 23 kg / 21 kg / 21 kg
- Meat 58 kg /54 kg /44 kg
- Fish 18 kg /16 kg /18 kg
- Dairy products 290 kg /257 kg /360 kg
- Eggs 210 pcs. /200 pcs. /201 pcs.
- Oils and fats 11 kg /10 kg /5 kg
- Tea and spices 5 kg / 4 kg / 3 kg
As you can see, the consumer basket in Russia for 2021 is different for different categories of citizens. This differentiation occurs due to the different needs of people of different ages in certain product groups. For example, as can be seen from the table, the minimum consumption of fruit and milk by children is much higher than that of working people or pensioners. Working-age citizens, on the contrary, consume more flour products, cereals and meat.
But these calculations, made in 2012 by Rosstat experts, do not at all coincide with the size of the minimum consumer basket in Russia, calculated by medical specialists. These data are shown in the table below, and for clarity, the average level of food consumption in the Soviet Union in the mid-1980s is shown nearby.
Product name /Minimum consumption for adults in 2021 /Standards of the Ministry of Health /Consumption norm in the USSR
- Bakery products and cereals /126 kg /96 kg /110 kg
- Potatoes /100 kg /90 kg /105 kg
- Vegetables /114 kg /140 kg /146 kg
- Fruits /60 kg /100 kg /80 kg
- Sugar /23 kg /24 kg /38 kg
- Meat /58 kg /73 kg /84 kg
- Fish /18 kg /22 kg /20 kg
- Dairy products /290 kg /325 kg /380 kg
- Eggs /210 pcs. /260 pcs. /280 pcs.
- Oil and fats /11 kg /12 kg /13 kg
- Tea and spices /5 kg /4 kg /5 kg
As you can see, Rosstat’s consumer basket is somewhat different from that recommended by the Ministry of Health for the rational nutrition of a working person. It only characterizes the possibility of living in conditions of austerity with a minimum acceptable income.

